Presented by:

Dan Garcia
I've always been fond of isometric 3D projections (in which cubes look like three symmetric 60º-120º-60º-120º rhombi) https://www.pcmag.com/encyclopedia/term/isometric-view and wanted to find a way to display 2D table data in 3D. So, I played around with canvas "shear" transforms for text, and aligned them with the stage elements to produce a 3D grapher.
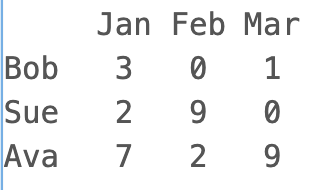
The DATA looks like any standard spreadsheet, with the first row the column labels, the first column the row labels, and the rest of the integer data in the middle. So for example you might have (not sure how this formatting will work), for a small company's sales:
     Jan Feb Mar
Bob   3   0   1
Sue   2   9   0
Ava   7   2   9
and it will graph that in 3D, AND allow you to write the labels "in 3D space", as if they are written on the left or right wall, or left or right floor.
- Duration:
- 3 min
- Room:
- Plenary
- Conference:
- Snap!Con 2022
- Type:
- Show Your Project
This session is a part of:
Bernat Romagosa
The Snap!shot hit returns! Join us for a face-paced round of some awesome things Snap! users have built. No slides allowed here, just neat projects from the community.
- Dashed Line Graphics Library
- Talk to Mt Everest, an elephant, or Charles Darwin
- Using Metaprogramming to Analyze Projects
- Generative Adversarial ML in NetsBlox: Circle GAN
- 3D Plotting of 2D Array Data
- Find the Minimum: Trying on the Shoes of an ML training algorithm
- A Small Simulation System
- Image Convolution in Snap!
- Build a Decision Tree from Data
- audio-Steganography experiments